
XRP price started a recovery wave above $1.420 and $1.4250. The price is now consolidating and might aim for a fresh move if it clears $1.4450.
- XRP price started a recovery wave above the $1.4220 zone.
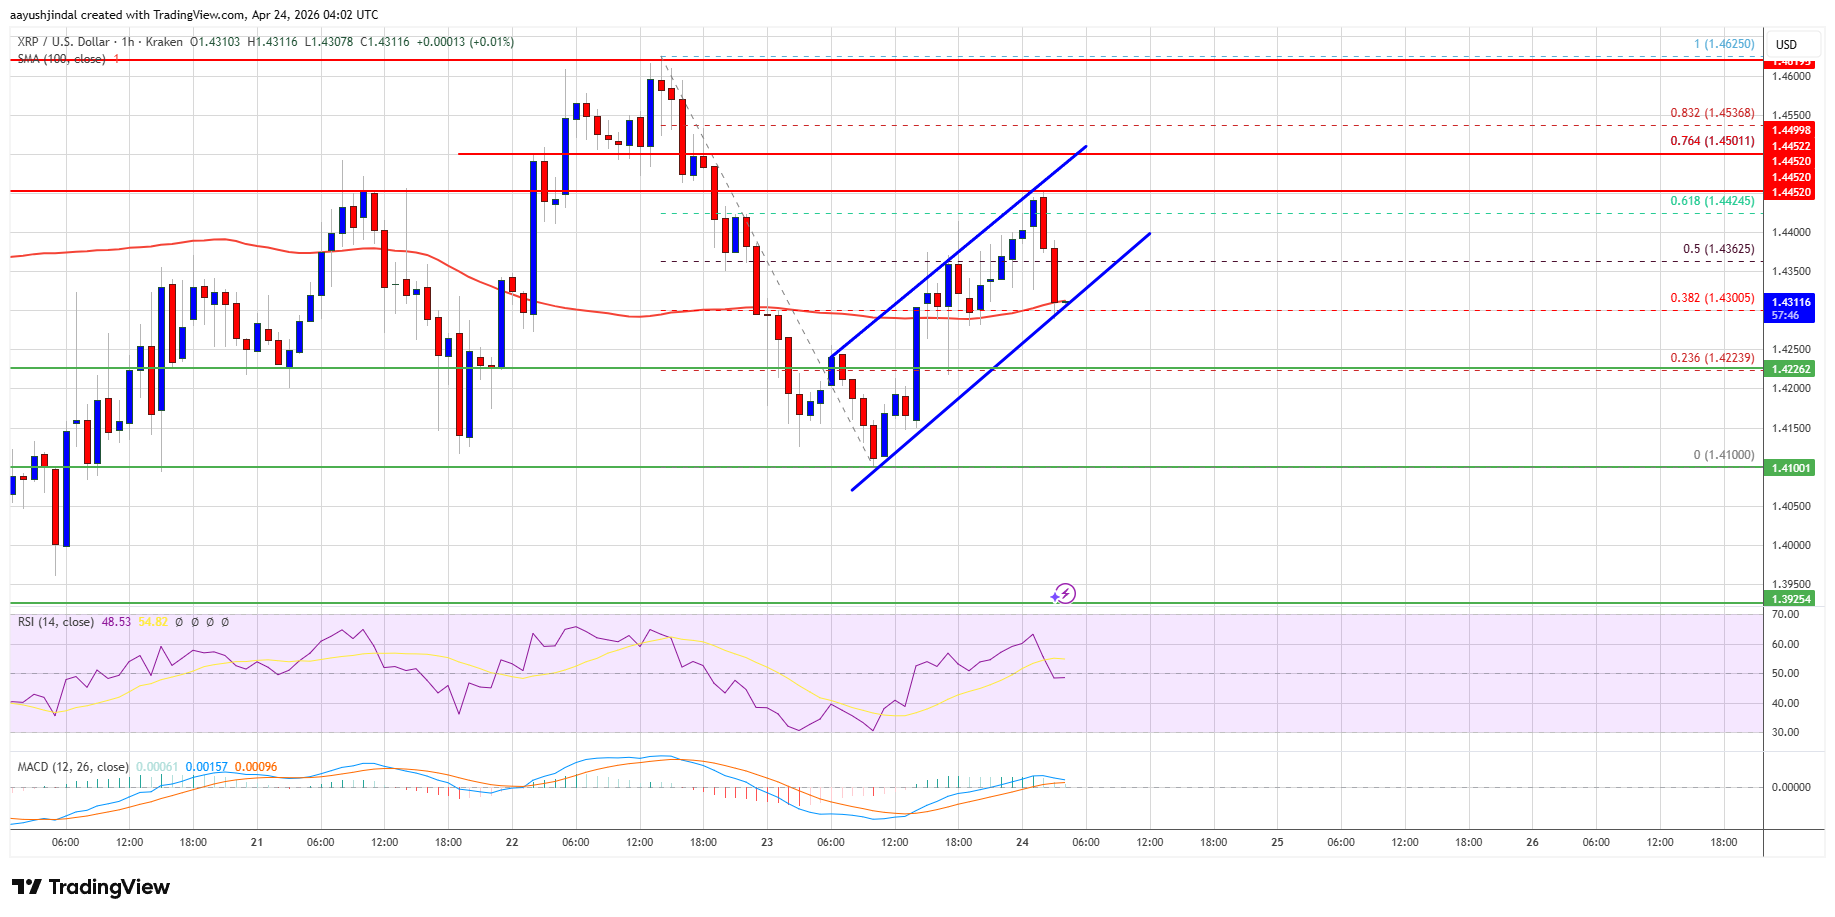
- The price is now trading above $1.4250 and the 100-hourly Simple Moving Average.
- There is a rising channel forming with support at $1.430 on the hourly chart of the XRP/USD pair (data source from Kraken).
- The pair could continue to move up if it settles above $1.4450.
XRP Price Holds Support
XRP price remained supported above $1.410 and started a recovery wave, like Bitcoin and Ethereum. The price was able to climb above $1.4150 and $1.420 to enter a short-term positive zone.
There was also a move above the 50% Fib retracement level of the downward move from the $1.4625 swing high to the $1.410 swing low. However, the bears are now active near the $1.4450 zone. Besides, there is a rising channel forming with support at $1.430 on the hourly chart of the XRP/USD pair.
The price is now trading above $1.430 and the 100-hourly Simple Moving Average. If there is a fresh upward move, the price might face resistance near the $1.4450 level or the 61.8% Fib retracement level of the downward move from the $1.4625 swing high to the $1.410 swing low.
The first major resistance is near the $1.4620 level. A close above $1.4620 could send the price to $1.480. The next hurdle sits at $1.50. A clear move above the $1.50 resistance might send the price toward the $1.5180 resistance. Any more gains might send the price toward the $1.5320 resistance.
Another Drop?
If XRP fails to clear the $1.4450 resistance zone, it could start a fresh decline. Initial support on the downside is near the $1.430 level. The next major support is near the $1.420 level.
If there is a downside break and a close below the $1.420 level, the price might continue to decline toward $1.40. The next major support sits near the $1.3750 zone, below which the price could continue lower toward $1.3550.
Technical Indicators
Hourly MACD – The MACD for XRP/USD is now losing pace in the bullish zone.
Hourly RSI (Relative Strength Index) – The RSI for XRP/USD is now below the 50 level.
Major Support Levels – $1.420 and $1.40.
Major Resistance Levels – $1.4450 and $1.4620.


